Friday, November 29, 2013

Bottom Dwellers Paradise

As has been observed in recent years, this is typically the best time of year to look for the beaten down stocks and sectors to make a rebound over the next 30 days or so as tax loss selling abates.

Some of these stocks that have had the worst of it in 2013 up till now could make out-sized gains as selling pressure ends and short sellers scramble to cover.

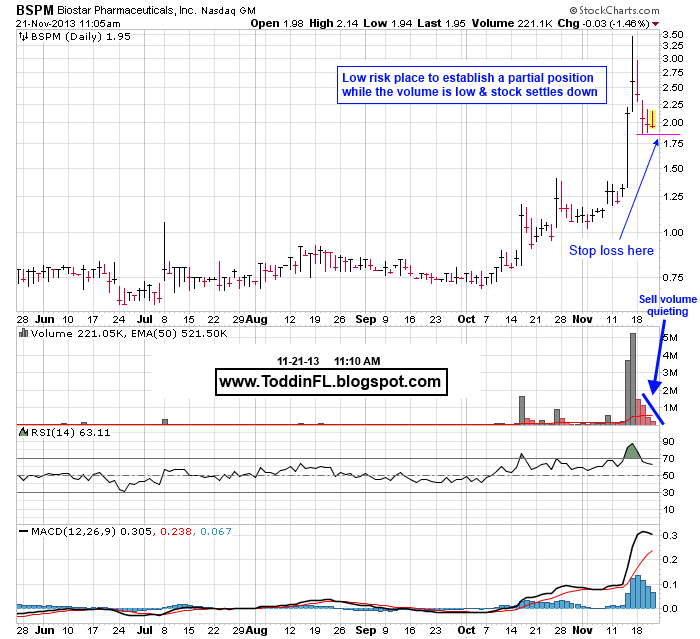
I'm not looking to chase the big winners for '13 right here after they've had such a nice run.  Let them pull in a bit before looking for an entry.

Here are some setups posted recently to Twitter, and a few more added today.

Companies mentioned in this post: Advanced Photonix (API), AEHR Test Systems (AEHR), Oxygen BioTherapeutics (OXBT), ChemoCentryx (CCXI), Iridium Communications (IRDM), GTx Inc (GTXI), Exco Resources (XCO), Coronado Industries (CNDO), NovaCopper (NCQ), Atlatsa Resources (ATL), Mitek Systems (MITK), Morgan Hotel Group  (MHGC)

ALWAYS use stop losses to protect your portfolio from potentially devastating losses.

Click on charts to enlarge:


Thursday, November 21, 2013

Latest Additions to Watch List

Here are some charts posted to Twitter today, many of them in the independent oil and gas exploration sector.  Alpha Pro Tech (APT) was posted at 1:00 PM and the stock advanced over 11% intraday from that point.

Companies shown in this post are Biostar Pharmaceuticals (BSPM), Envirostar (EVI), Magellan Petroleum (MPET), Tengasco (TGC), Alpha Pro Tech (APT), Globalscape (GSB), CAMAC Energy (CAK)

Click on charts to enlarge:


Wednesday, November 20, 2013

Market High Fliers Taking Much Needed Rest

(Note: This was written on Tuesday afternoon at around 3 PM but was not posted to the blog.  The last few charts were annotated today.)

Recent action the U.S. equity market has seen both the DJIA and S&P 500 push to all-time highs yesterday, only to sell off on afternoon weakness and finish off the day's highs.  The smaller cap Russell 2000 index (IWM) most recent high was set back on October 29.

One of the leading sectors in this recent market push higher, the 3D printing stocks all pushed to new highs yesterday, and then reversed badly in late afternoon trading.  This could be a sign that the move in the sector will now take a much needed rest.

3D Systems (DDD), Stratasys (SSYS), voxeljet (VJET), and Organovo Holdings (ONVO) are all reversing down from the big moves they've made lately.

Add to that the recent drop in Tesla Motors (TSLA),  and some weakness showing up in the solar stocks like SolarCity (SCTY), Yingli Green Energy (YGE) SunPower (SPWR), First Solar (FSLR).

There has been an inordinate amount of chatter recently asking the question, "is the market in bubble territory?"  From CNBC, Bloomberg TV to Barron's magazine and on Twitter, the question has been hotly debated.

While I don't think we're in a bubble akin to the 1998-2000 period, there definitely are areas of frothiness that need to be corrected.

These pullbacks we've seen in some of the aforementioned stocks are healthy, and there's possibly more profit taking that will occur in more stocks in those sectors.

Here are the charts of the stocks mentioned above.

Click on charts to enlarge:


Recent Charts Posted on Twitter

Here are some recent charts posted on twitter, and a few more that were annotated this morning and have been added to my watch list.


Wednesday, November 13, 2013

Evening Scan for Trading on Thursday

Groups of interest that seemed to come up in some of my scans on finviz.com tonight were railroads, medical appliances & equipment, education services, and some of the stocks in the publishing sector.

Here are some of the charts that caught my interest.  ALWAYS use stops to protect from potentially devastating losses to your account.

Med. appliances/equip:  ARAY, CSII, FONR, GMED, GNMK, IRIX, MDT, NUVA, SNN, STE, SYK, SURG, VAR, ZMH 

Railroads: CP, CSX, GBX, KSU, NSC, PACR, TRN, WAB

Education services:  LOPE, ESI, DV, EDU, EPAX, EDMC, GPX, LRN, XRS, XUE

Publishing:  LEE, MNI, TRI, MDP

IRIX has my interest for possibly a longer term swing trade as it looks early in its move, even though it's already moved 50%.  That volume surge is impressive.

Click on charts to enlarge:


This last one was posted to Twitter and StockTwits just before the market opened today.


Taser Intl: High, Tight Flag

Taser Intl (TASR) is well-known for being the leading manufacturer of non-lethal stun guns used by law enforcement.  The company saw its stock make a major move starting in 2003 when the stock was heavily shorted, and the company's products gained popularity.

TASR previously formed a high, tight flag formation (as introduced by Wm. J. O'Neil in his best-selling book "How To Make in Stocks") back in July of 2003.  From that breakout, the stock advanced a stunning 2,738% in the ensuing 39 weeks.

Here's the chart setup from 2003.  Note that the prices in the chart reflect multiple splits that took place during the run up.  The actual breakout price was a little over $13 a share.

Click on chart to enlarge.


Recently, TASR saw a surge in earnings due to new orders, and the stock jumped dramatically in response.  It settled down for a few weeks in tight consolidation, then burst to new highs on expanding volume.

I mentioned the idea that TASR might have completed this formation back on November 5 on StockTwits and Twitter.

The last 2 weeks the stock has displayed relative strength as it's been sitting just above its breakout from the flag, while other market leaders like Tesla (TSLA) and Linked In (LNKD) have seen significant profit taking.

Today, TASR seems to have regained its strength and looks poised for another move higher.  Here's an updated weekly view of the stock.  While the stock is not heavily shorted like it was back in 2003, it's still worthy of consideration.


 Afternoon update:  I've added the daily chart as of 2:10 PM for comparison to the 2003 setup.