Tuesday, June 26, 2012

Back in Correction Mode

A week ago here and here a list of stocks was mentioned as potential new leaders if the market continued to firm up and made a move higher.  Since then the U.S. broad market indices broke above key intermediate term resistance levels, only to give it all back last Thursday in a big flush down.  

Friday saw the market turn back up as the Russell Indexes underwent re-balancing.  Then the market started out this week with another sharp decline yesterday across as all broad U.S. indices, with the S&P 500 down 1.6% and the market leading Nasdaq Composite down 1.95%.

Investor's Business Daily is now labeling the current market situation as "market in correction".  So with the broad market weakness for two of the last three trading days it's not prudent for most investors to trade actively or in size.  Continue to build a list of potential new market leaders and watch how they act compared to the broader market.

Some of the names mentioned in those two prior posts have broken out and stayed above their breakout points, while others have dropped back below and are back inside their previous bases.  

Here's a beginning review of some of those names previously mentioned.  

Click on chart to enlarge view:


Saturday, June 23, 2012

Low Priced Setups for Monday, June 25, 2012

Here are the results of a scan completed on finviz.com over the weekend. 

The criteria was: 
A) stocks under $10
B) average trading volume over 200K per day
C) percentage of floating shares shorted at 10% or higher. 

These are only for short term trading where I'm looking for 5-7% moves (more in some cases); not long term holds for your IRA.  They are low priced and thus inherently carry more risk.  If you decide to trade in this arena know that large losses can come very quick, so you must monitor them closely if you put on a trade.

Here are a few that already broke out from consolidations on Friday.  While the initial move has been made, they can still run higher.  So don't forget to check the charts from this group: AMSC, ARAY, CLDX, CRIS, CYTX, FTR, RJET, STRI.

From the list below, my favorites are AMRS, MRGE, THLD.

Some that didn't quite make the list below but are still on my watch list: CLWR, DANG, GTAT, GTIV, MILL, NKTR, NR, NYT, SQNM, TSPT.

There are plenty of other low priced stocks that didn't meet this criteria that are setting up for moves.  Take note of the solar group & some of the newspaper stocks - LEE, MNI.

ALWAYS use stops to protect from big losses.


Click on charts to enlarge view:


Thursday, June 21, 2012

Market Commentary for Thursday, June 21, 2012

Yesterday the U.S. market indices responded to Bernanke's early afternoon announcement of an extension to the "Operation Twist" program with a quick drop, then recovered within minutes, and ended the day mostly flat.  The DJIA and S&P 500 closed down less than 0.20%, while the Nasdaq Composite eked out a small gain.

So it appears that the action taken by the Fed was largely anticipated, and now the market will turn its focus looking for the next catalyst.  The Fed lowered their target for GDP growth for the full year, so it appears the U.S. economy continues to muddle along at a slow rate of growth, which is still better than what's happening in the EU zone.

Market leader Bed Bath & Beyond (BBBY) reported earnings and revenues after the close that were higher than the prior year's quarter, but revenues were lower than analyst estimates.  The company also lowered earnings estimates for the second half of the year as it ramps up its e-commerce business to compete better with Amazon (AMZN).  The stock is down 10% in the pre-market.  

Athena Health (ATHN) reversed lower in heavier trade, and now sits just above its breakout point of $79.42, and Cerner (CERN) also closed lower in heavier volume, falling back inside its cup breakout pattern.  Other market leaders pulled back or traded sideways in moderate volume.  

Going forward, it feels like the market will pause for a bit to consolidate the recent run up and digest the news flow.  The indices are now forming what looks to be an upward parallel channel, and a pull back inside that channel would be constructive to the bull case as detailed in the charts below.

We could see some sideways backing and filling in an upper trading range that corresponds to the trading during the second week of May as shown in the first chart, or the market could drop a bit lower to retest the lower area of the upward parallel channel.  Currently I'm leaning towards the latter, but keeping options open to all scenarios.

Click on chart to enlarge view:


Wednesday, June 20, 2012

Market Commentary for Wednesday, June 20, 2012

Much of the skepticism for a continuation of the rally in the U.S. stock market from the past weekend was put to rest in the first 2 days of trading of this week.  On Monday the market started out weak, but then quickly regained its footing by mid morning.  Even though the indices finished mixed on Monday with the DJIA actually closing in the red, the market leading stocks dominated the action with impressive price and volume action.

Tuesday the rest of the indices joined the rally with the DJIA adding 95.51 points to close at 12,837.33 and the S&P 500 jumping 34.43 (+1.19%) in heavier trade.  Moreover, the rally broadened with more leading stocks showing positive action.  The list of stocks on the move in heavier trade grew in Investor's Business Daily, a sign that institutional investors are stepping back into the market.

Still, there remains some worries whether the market has been moving in anticipation that the Fed will announce a new round of QE, and that if the Fed disappoints tomorrow when the FOMC minutes are released, that the market will fall apart.  While we certainly cannot rule that out, the action in leading stocks points to a broadening of the rally and a continued move higher.

That said, there are some market indicators now pointing to overbought levels where the market has previously stalled.  So a sideways pause or slight pullback to allow digestion of the recent gains certainly would be well within reason.  

It's important to remember NEVER to chase a stock higher as it almost always leads to a poor entry.  For those who missed the initial move, know that if the rally continues to broaden, more stocks will setup in proper bases and offer more opportunities.


A partial list of leading stocks to monitor; listed in no particular order:  ASPS, UNFI, QCOR, CYBX, ULTA, ATHN, EQIX, EBAY, SXCI, ACIW, ALXN, BBBY, LL, DNKN, UA, MLNX, CRUS, MGAM, CSTR, XPO, AAPL, ROST, BWLD, CERN, TJX, WWWW, PRAA, ALGN, VSI, ELLI, MCK

Click on chart to enlarge:


Monday, June 18, 2012

Stocks on my Watch List for the Week of June 17, 2012

The Greek elections turned out "market favorable", according to various news services, yet pre-market futures are slightly lower at the moment.  I want to see how the market leading stocks act once trading actually begins on Monday, and whether there will be a strong, convincing  follow thru this week to the positive action that occurred last Friday.

Investors Business Daily is and always has been an excellent source for uncovering market leading stocks. But they sometimes have an interesting way of interpreting chart patterns.  Take Questcor Pharmaceutical  (QCOR) for example.  The weekend paper on page B2 stated that QCOR jumped past a 6 week cup base.

This is brought to attention to stress the importance of looking at setups on all time frames, especially when looking for potential market leaders early on in a move after a general market corrective phase like what has occurred.  If I looked at the daily chart only, it may not make my immediate scan.  But the weekly chart shows a much more favorable pattern.

IBD likes to see pullbacks inside the handle area of a cup with handle pattern stay within a 15% range.  In the case of QCOR, the high on May 1 was $46.84 and the intraday low on May 18 was $37.77.  So that represents a 19.4% correction, and thus over the 15% limit for handles.

But QCOR has been forming a long base going back to last December, so while the market was rallying from November into Spring of this year, QCOR was forming the cup of its base.  Then when the market  began its correction, the stock formed the handle falling 19%.  Higher growth market leaders often make moves greater than general market , so the 19% move down is reasonable when considering what the general market was doing.

So when you look at the longer term chart in the scope of the entire move and considering what the market has done during that time period, the weekly setup looks quite favorable as the stock is at new all-time highs.  Remember that technical analysis is not an exact science.

Here are some stocks I'm watching to emerge if the market continues to firm up and acts constructively.

ALWAYS use stops to limit losses.  

Click on charts to enlarge view: 


 Others of note:  ATHN, ACIW, EBAY, LL, BBBY, TJX, MGAM, UA, CRUS, CERN, BWLD


Sunday, June 17, 2012

Market Commentary for Monday, June 18, 2012

Friday the market finished the week on a strong note as the S&P 500 not only rallied above the short term resistance of the previous 6 days, but also above intermediate term resistance at the 1336-1338 level to settle at 1342.84, +1.03% for the day.  With quadruple witching, volume kicked in, and so when combined with the strong price action it represents a valid follow through day.

The Nasdaq Composite closed at 2872.80 +1.29%, breaking above the upper line of the downward parallel channel it's been in since mid April, yet failing to break above recent intermediate term resistance at 2883.  

The DJIA was up 0.91%, while the important Dow Jones Transportation Average did not fully confirm the action of the other indices as it was up only 0.67%, and also failed to break above prior resistance from the previous 6 days.  So all in all, I would grade the action of the broad indices as a "B".  

As I've mentioned in recent posts it's possible that the first move out of the recent consolidation phase could reverse back the other direction, trapping those who piled in once support or resistance levels were breached.  

So while the action on late Thursday and Friday are encouraging and some market leading stocks have pushed out of bases and others have firmed up, with the election results looming in Greece tonight, I'm a little skeptical of going long full bore until I see how the market reacts to the news on Monday.

It's early in this rally attempt so we have to be patient and see how the market acts to the bevy of news from the elections in Greece, to the notes coming out from Bernanke and the FOMC meeting on Tuesday and Wednesday.

Ultimately, the price and volume action of the market leading stocks takes precedence over any news event.  I'll go through the list of stocks that I'm watching closely as we approach the week ahead in my next post.

Here are the charts of the broad market indexes.  

                     Click on charts to enlarge view:


Thursday, June 14, 2012

Market Commentary for Thursday June 14, 2012

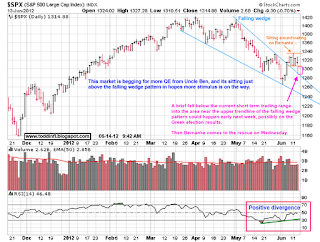
The S&P 500 finished a bit lower yesterday after a rally early in the day fizzled out starting around 1:45 PM.  The index did manage to finish off the lows of the day with a rally in the last 5 minutes of the session, but still closed down 9.30 points to settle at 1314.88.

Over the last 5 trading sessions, the S&P has been trading in a range bordered by 1335 and 1306.  But the interesting aspect is that big early morning gap ups on June 7th and June 11th were sold into with the market then selling off hard, and conversely early morning weakness on June 8th and June 12th were bought and the market rallied.

So we're flip-flopping around in this range where it's clear you must sell into strength and buy weakness (assuming you are a short term trader) as there is no follow through behind any of the moves.  Eventually, this range will be broken and the market will make a decisive move.  

Because of the defined trading range, there are sure to be stops set on either side.  It wouldn't surprise me to see the market start in one direction and trigger those stop orders, only to reverse and head in the opposite direction in a larger more decisive move.  

So know in advance that when the news flow comes out over the weekend from the Greek elections, and then the middle of next week with the FOMC meeting with Bernanke potentially making a move for more QE stimulus, that the move that begins out of the smaller trading range could easily be one that reverses.

Here's a few charts of the S&P 500 with several scenarios.  The 8 week downward parallel channel shown in the second chart is well-defined.  Also be mindful of options expiration tomorrow which could skew market action.

Click on charts to enlarge view:


Monday, June 11, 2012

Market Wrap Up for June 11, 2012

The market started Monday with hopes for a possible confirmation rally that would validate the reversal off the lows from last Monday.  News over the weekend out of the EU that banks in Spain would receive bailout funds ignited pre-market futures.  There were hopes that this bailout news would calm world markets and lower short term borrowing costs for troubled countries in the Eurozone.

But not more than 30 minutes into today's session, the Nasdaq reversed those pre-market gains and turned negative.  The S&P 500 and DJIA soon followed.  It was all downhill from there, as the Nasdaq finished just off the lows of the session on increasing volume, creating another distribution day.

This remains a market prone to sudden swings given the news flow, and one where the majority of market participants should stay in cash until a proper confirmation day in the broad market indexes surfaces.  

Despite my overall short term skepticism of the current market environment, there are a number of stocks that are holding up well in spite of the weakness, so it's important to watch the market closely every day as we're only 5 days from the recent bottom, and a confirmation day can occur at any time.

Here are charts of the major U.S. indices.   Keep an open mind to all possibilities.

 Click on charts to enlarge view:


Here are a few charts of stocks holding up well to put on a watch list; not a recommendation to buy now.