Monday, January 28, 2013

On Watch for Monday, January 28, 2013

Just past midday into the trading day and some leading stocks have been hit hard - SSYS, DDD, and PRLB in the 3D printing sector are down between 3.6% for PRLB to over an 11% loss for DDD.

The market has had a nice run with many pundits saying it's overbought.  I still think the market could forge ahead near term, but the action early on today shows that you do not want to chase stocks that are extended. 

Stocks mentioned in this post:  GSIG, PACT, SEED, PAMT, NVTL

ALWAYS use stops to protect from devastating losses to your portfolio.  Click on charts to enlarge.


Saturday, January 26, 2013

Setups Posted to Twitter on Friday

These are setups that I marked up and posted to Twitter during trading hours yesterday, which I'm now posting here.  A few of them perked up during the trading day, but most of them still have potential for next week.

The Merck (MRK) chart was posted to Twitter on Thursday, but it triggered yesterday so I'm putting it here as well.

Stocks mentioned in this post:   STEC, ZQK, MTSL, EOX, SCLN, RGEN, NVMI, MRK

ALWAYS use stop losses to manage portfolio risk.  Click on charts to enlarge.


Thursday, January 24, 2013

Tepper Remains Bullish for 2013

Appaloosa Management chief executive David Tepper went on Bloomberg TV on Tuesday, and made his case in a 30 minute interview why he thinks the equity markets have more room on the upside in 2013.

It's always interesting to hear how a top investing professional goes about looking at the macro view and developing a thesis.

Here's the video.

Wednesday, January 23, 2013

More Setups Under $10 - January 23, 2013 PM

Some of these trade very thinly, and some operate in that bastion of strict financial regulation and scrutiny known as China.  So buyer beware.

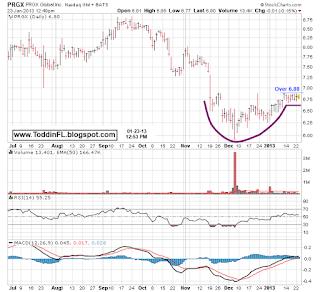
Stocks mentioned in this post:  PRGX, CSUN, RBCN, MOD, ETM, FENG

ALWAYS use a stop loss to avoid blowing up your account and wrecking your life.


Setups for Wednesday, January 23, 2013

ALWAYS use stops to keep from blowing up your account.  If you decide to trade penny stocks, expect to lose your spouse and house.

I will post more once the trading day starts.


Tuesday, January 22, 2013

More Setups From Weekend Scan

Here's a continuation from weekend scans - and it's a partial list because there are simply too many to list.  Listed in no particular order.

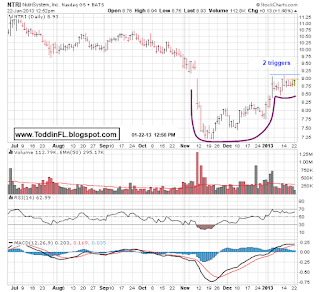
Charts listed in this post:  OME, NTRI, MSO, MACK, LPR, KONG, KBX, EPM, ENVI

ALWAYS use stops to limit losses to your portfolio.

Click on charts to enlarge:


Frontline (FRO) Crouched & Ready

Here's another heavily shorted shipper that looks poised to make a move after a long downturn. 

Click on charts to enlarge:


Shippers & Oil/Gas Drillers on Watch for Tuesday, January 22, 2013

The long holiday weekend gave me a chance to do more scanning than usual.  It turned up a big list of potential setups, in fact, MANY more than I can annotate and bring to this blog. 

Two sectors that caught my attention were shippers and oil and natural gas exploration companies.  Some of these have beaten up pretty badly, and now appear to ready for a tradeable, short term bounce.

I'm looking to book partial profits after any initial pop, then move stops up to breakeven and scale out of the remaining position.

ALWAYS use stop losses to avoid devastating losses to your portfolio.

Click charts to enlarge:


Wednesday, January 16, 2013

Potential Explosive Pattern in the Making

Late in the trading day yesterday, a recent IPO, Ruckus Wireless (RKUS), exploded higher to new all-time highs on very strong volume.  The stock was mentioned on Twitter and StockTwits as the move was happening.  The stock was put into focus on Monday evening by CNBC's Jim Cramer on his show Mad Money.

Here's Cramer's take on the company:  Cramer video

The high, tight flag pattern is a rare occurrence in the stock market, and is often misinterpreted by chartists.  The pattern was introduced in William J. O'Neil's excellent book, "How To Make Money In Stocks".  In the book, O'Neil explained how he traded Syntex after it introduced the birth control pill.  He also gave several other chart examples of the pattern.

Here is O'Neil's description of the pattern from his book: 

"A high, tight flag price pattern is rare and occurs in no more than one or two stocks during a bull market.  It begins by moving approximately 100% to 120% in a very short period of time (four to eight weeks) and then corrects sideways, usually in three, four, or five weeks, no more than 10% to 20%.  This is the strongest of patterns, but it's also very risky and difficult to interpret correctly.  Many stocks can skyrocket 200% or more off this formation."

RKUS is extended from it's most recent brief consolidation, so it's not smart to chase the stock here.  But watch it closely to see if it can settle into a tight sideways base. 

The chart below is merely a projection of how I would "like" to see it play out over the next few weeks.  A few weeks of tight price action to allow the stock to shake out some weak hands leading up to the earnings release in February could set the stock up for a new run to more highs. 

As ALWAYS, use stops to protect your portfolio from big losses.

Click on chart to enlarge.


Wednesday, January 9, 2013

Watchlist for January 9, 2013

Some of these charts below aren't necessarily actionable right now, but they may be worth adding to your watchlist to see if price action tightens up.  Also, a few of these trade very thinly, so extra caution is warranted.

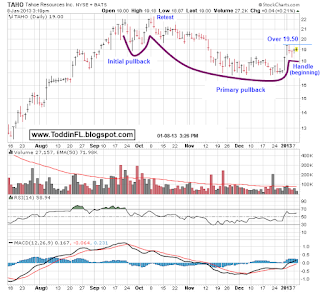
Charts shown in this post:  YONG, MTDR, KIOR, CUTR, TAHO, HWD, RVM

ALWAYS use stops to protect your portfolio from big losses.